
Why test inks cannot tell the full truth about surface free energy
A comparative study between test inks and contact angle measurements in our laboratory
There are a range of methods for activating the surface when treating materials before coating, bonding or printing. These include thermal or electrical methods, such as plasma, flame or corona treatment, and chemical treatment with oxidizing gases. Equally important are cleaning steps which remove hydrophobic substances from the surface. All these methods increase the surface free energy (SFE) and therefore improve wettability and adhesion.
Norms such as DIN 55660 for coating materials and DIN EN 828 for adhesive processes specify contact angle measurement as the method for determining the SFE of surfaces and for checking an activating or cleaning pretreatment process. In addition, test inks, which are intended to reflect the SFE based on liquids with set surface tension (SFT), are also frequently used.
According to the ink test method, complete wetting always occurs when the values of the SFE of the solid and the SFT of the liquid are equal. Many scientific authors have refuted this wetting theory and have shown that only an analysis of the polar and disperse interaction parts of the SFE and the SFT provide a complete picture of the wetting process. Contact angle measurements, which take these interactions into account, and ink tests should accordingly lead to different evaluations of surfaces and therefore also to different assessments of the quality of a pretreatment process.
In the present study, we have compared SFE results from contact angle measurements with those from ink tests for 13 very different materials. We also carried out comparative measurements on three plasma-treated plastics. Both the small number of consistent results and the large number of deviations can be conclusively explained when we take the effect of polar and disperse interactions into account. It appears that the SFE result of an ink test must be called into question for many samples. In this article, we also point out some advantages of the contact angle method in measurement practice.
Background
Untreated plastics and materials with hydrophobic contamination have a low SFE and low polarity. These characteristics lead to poor wetting and adhesion, particularly in contact with water-based varnishes and printing inks as well as adhesives and coating substances. A cleaning or activating pretreatment process is therefore necessary for polymers and many other materials.
Established activation processes, such as plasma or flame treatment, increase the SFE and therefore improve the processing characteristics. Contact angle measurement and the ink test are two frequently used methods for determining the SFE and therefore for checking the need for or the success of a pretreatment process.
The test ink method
The ink test is based on the assumption that the SFE of the solid is equal to the SFT of a liquid which just fully wets the solid. Test inks consist of a series of liquid mixtures, each with a set SFT, usually in increments of 2 mN/m. During the test, one of the inks is applied to the sample with a brush stroke. If the ink contracts, the ink with the next lower SFT is used until the brush stroke produces a stable film. This corresponds to complete wetting of the sample. When the first stroke is stable, the SFT is increased in steps. The SFT of the test ink which just forms a film is equated to the SFE of the material.
The contact angle method
With a contact angle measurement, a drop of a pure test liquid is dispensed onto the solid sample. The drop is recorded using a camera, and the video image is evaluated.

The contact angle θ is measured at the point where the contour line of the drop cuts the surface line. The better the wetting, the smaller this angle is; for complete wetting, it is 0°.
According to Young’s equation, which is proven since over 200 years, there is a fundamental relationship between the contact angle θ, the SFE of the solid σs, the SFT of the liquid σl and the interfacial tension (IFT) σls between liquid and solid:


Carrying out a contact angle measurement with several characterized test liquids enables both the SFE and the IFT to be calculated based on different models. Most of these models start from the polar and disperse parts of the liquid SFT and the solid SFE.
The model according to Owens, Wendt, Rabel and Kaelble (OWRK) (see bibliography) is frequently used in the field of plastics analysis, and we therefore also use this method for the present study.
Experimental part
Samples under investigation
To make the study as broad as possible, we have investigated 13 materials including plastics, minerals and metals. We also chose very different material qualities, from almost ideally chemically homogenous surfaces and technical raw materials to finished commercial products. With this selection we have covered a broad spectrum of possible surface-analytical problems when comparing methods.
| Sample | Quality | Designation |
|---|---|---|
| Acrylonitrile butadiene styrene | Technical | ABS |
| Aluminum | Finished product (foil) | Aluminium |
| Glass | Finished product (microscope slide) | Glass |
| Mica | Chemically homogenous monocrystal, freshly cleaved |
Mica |
| Polyamide 6 (Akulon® K222 D) |
Technical | PA6 |
| Polyamide 6 + 3% Cloisite® 30B |
Technical | PA6 + 3% C30 |
| Polydimethylsiloxane | Pure, synthesized | PDMS |
| Polyethylene | Finished product (film) | PE |
| Polyethylene terephthalate | Finished product (bottle) | PET |
| Polypropylene | Technical | PP |
| Polytetrafluoroethylene | Technical | PTFE |
| Polyvinyl chloride | Finished product (tablecloth) | PVC |
| Silicon wafer | Chemically homogenous monocrystal | Si |
Tab. 1: Samples under investigation
The change in SFE during plasma treatment was also investigated for PDMS, PVC and PET.
Sample preparation
Before the measurements were carried out, all samples (except mica) were cleaned with a degreasing detergent solution and then rinsed very thoroughly with hot and cold mains water and finally with distilled water. Remaining water drops were subsequently removed with isopropanol. The samples were finally dried with clean compressed air.
Test inks used
We carried out tests with two different series of test inks for all samples:
- Series A (yellow): Colored mixture of ethanol and water
- Series B (blue): Colored mixture of formamide and ethylene glycol monomethyl ether (EGMM)
The tests were carried out in accordance with the standard ASTM D 2578-84.
Inks with SFT values in 2 mN/m increments in the range between 30 and 56 mN/m were used for each test. SFE values above 56 mN/m and below 30 mN/m could therefore not be measured.
Conditions for contact angle measurement
The contact angle measurements were carried out using our Drop Shape Analyzer – DSA100. A software-controlled dosing system for several liquids was used for the dosing operation.
We chose the three standard test liquids water, diiodomethane and ethylene glycol for determining the SFE. This choice covers the bandwidth from purely disperse to highly polar and is therefore particularly suitable for determining polar and disperse parts. In quality control, measurements are often carried out with the two test liquids water and diiodomethane which represent two extremes in respect to polarity.
Static contact angles were measured (measurement at constant drop volume). The drops were produced at the needle of the dosing unit, carefully deposited on the sample and subsequently analyzed. There were no time-dependent changes in the contact angle for any of the samples.
Conditions for plasma treatment
We used a Rheinhausen Plasma piezobrush® plasma pen for plasma-treating PDMS, PVC and PET. The pen was positioned above the DSA100's automatic sample table at a distance of 8 mm from the sample. The axis speed was set to 2 mm/sec. As soon as the treatment began, the axis was moved over a distance of 40 mm and then back again so that the total exposure time was 40 s.
Treatment with an exposure time of 60 s was also carried out for PDMS and PVC; in this case, the axis moved the sample under the pen one more time.

Results and interpretation
Measurements on untreated samples
The following table contains the SFE results from the contact angle measurements and the ink tests for the materials which were not plasma-treated:
| Sample | SFE by OWRK from contact angles [mN/m, pol. fract. in %] | Test ink A [mN/m] |
Test ink B [mN/m] |
|---|---|---|---|
| Acrylonitrile butadiene styrene | 37.1 [16%] | 34 | 34 |
| Aluminum | 55.9 [46%] | ≥56 | ≥56 |
| Glass | 64.6 [50%] | >56 | >56 |
| Mica | 53.7 [24%] | »56 | »56 |
| Polyamide 6 (Akulon® K222 D) |
50.6 [19%] | ≥56 | ≥56 |
| Polyamide 6 + 3% Cloisite® 30B |
52 [24%] | ≥56 | ≥56 |
| Polydimethylsiloxane | 21.6 [0%] | «30 | «30 |
| Polyethylene | 32.2 [0%] | 30 | 30 |
| Polyethylene terephthalate | 44.2 [3%] | 34 | 34 |
| Polypropylene | 29.6 [0%] | ≤30 | 30 |
| Polytetrafluoroethylene | 16.1 [0%] | «30 | «30 |
| Polyvinyl chloride | 47.1 [3%] | 30 | 32 |
| Silicon wafer | 48.5 [39%] | 46 | 42 |
Tab. 2: Results of comparative measurements between contact angles and ink tests for all untreated samples
In the case of the two very low-energy polymers, PDMS and PTFE, the SFE values were less than 30 mN/m. In principle, this measuring range cannot be measured with commercially available test inks (starting from 28 or 30 mN/m). We were unable to draw any conclusion regarding the correlation for glass, as the value of 64.6 mN/m measured by means of contact angles was above the range of the test inks used.
The results for the two samples, PE and PP, marked green in the table corresponded well. With all other samples, in many cases there were considerable differences between the contact angle and test ink results, and also sometimes differences between the test inks.
Interpretation based on interfacial tension
It can be seen that the two samples with good correspondence have low energy and are non-polar, while the deviations occur with higher-energy, polar samples. This can be explained by the fact that the ink test ignores a variable which is important for wetting, namely the IFT (see Fig. 2). According to the test ink method, complete wetting occurs whenever the SFE is equal to the SFT of the liquid. This is the case when the vectors σs and σl in Fig. 2 are of equal length. The IFT σls is not taken into account. In fact, the IFT can be greater than zero even when σs and σl are equal.
The following diagrams use Young's equation to illustrate the possibility of different wetting in cases where the SFE and SFT are equal in each case.

Accordingly, incomplete wetting can occur even when SFE and SFT are equal; in fact, this is very likely.
The IFT depends on the interactions between solid and liquid. In the absence of any attractive interactions between liquid and solid the liquid tends to minimize its interface with the solid, i.e. it avoids wetting the solid. Accordingly, the IFT between solid and liquid is maximized in the absence of interactions and decreases with increasing interactions between solid and liquid.
Polar and disperse contributions to SFE or SFT originate from physically different interaction processes. As a result, all common theories to determine the IFT take the polar (index p) and disperse (index d) contributions of SFT and SFE into account:

This is done such that the polar parts of the solids’ SFE interact solely with polar parts of the liquids’ SFT and disperse parts of the solids’ SFE interact solely with the disperse parts of the liquids’ SFT.
The following figure illustrates this behavior.


The figure shows a liquid with a total SFT of 50 mN/m getting into contact with a solid with an SFE of also 50 mN/m. Thus, following the idea of test inks, the liquid should wet the solid completely.
The large hands represent the (often stronger) polar parts and the small hands the (often weaker) disperse parts of SFE and SFT, respectively. The upper panel shows a perfect match between the polar and disperse parts: every polar hand of the solid grabs a polar hand of the liquid and every disperse hand finds its disperse partner. The attracting interaction between solid and liquid is maximized and the interfacial tension vanishes. In this case of a vanishing interfacial tension, the contact angle becomes zero as illustrated in the lower panel of Fig. 4. However, in practice such a situation can indeed almost exclusively be found if totally disperse liquids get in contact with totally disperse solids.
The lower panel of the figure shows the case in which the distribution into polar and disperse parts of SFE and SFT are different. In this example, there is only one pair of large polar hands and small disperse hands grabbing each other, respectively. As a consequence, there is a remaining interfacial tension in the liquid-solid bond. This remaining interfacial tension results in a non-vanishing contact angle as illustrated in the top and middle panel in Fig. 4. Despite SFE and SFT being equal, the liquid does not fully wet the solid as expected when following the test ink idea. This is exactly the case when a test ink is applied on a solid with a different degree of polarity.
In another study we have determined the polar and disperse parts of the test inks used for the present work. We found that the test inks with an SFT of 30 mN/m are almost completely non-polar and that the polarity increases with the SFT value. Knowing that, it can be understood why only for PP and PE the SFE values detected with the test inks agree with that determined with contact angle measurements. For these samples, in addition to SFE and SFT being equal, also the polarities are the same (polar part of 0 mN/m). Thus, according to the wetting theories, the IFT vanishes and the test inks fully wet the solid, i.e. exhibit a contact angle of zero degrees. For all other possible combinations of test inks and solids in which SFE and SFT are equal, the polarities are different so that the wetting test with the test inks cannot give the solid’s SFE. Moreover, the polarities for the blue and yellow test inks having the same SFT value are different. This explains why for example for Si even the SFEs determined with the two different test inks were different.
Measurement on plasma-treated samples
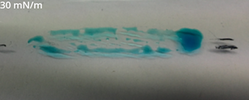
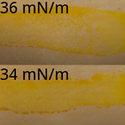
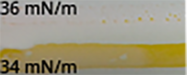
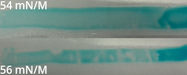
The difference between contact angle measurements and test inks was most obvious in the case of investigations carried out on plasma-treated samples. The following tables 3a), b) and c) contain the results for PDMS, PVC and PET before and after treatment with different exposure times. We have documented the wetting patterns for the test inks.
| a) PDMS | |||
| Duration | SFE by OWRK from contact angles |
Test ink A | Test ink B |
| 0 s |
Total: 21.6 mN/m Polar: 0.0 mN/m Disperse: 21.6 mN/m |
Total: < 30 mN/m | Total: < 30 mN/m |
| 40 s |
Total: 40.3 mN/m Polar: 14.2 mN/m Disperse: 26.1 mN/m |
Total: < 30 mN/m |
Total: < 30 mN/m |
| 60 s |
Total: 67.9 mN/m Polar: 42.3 mN/m Disperse: 25.5 mN/m |
Total: < 30 mN/m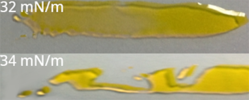 |
Total: < 30 mN/m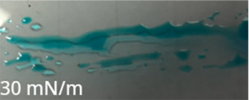 |

| b) PVC | |||
| Duration | SFE by OWRK from contact angles |
Test ink A | Test ink B |
| 0 s |
Total: 47.1 mN/m Polar: 1.3 mN/m Disperse: 45.7 mN/m |
Total: 30 mN/m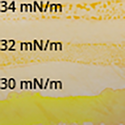 |
Total: 30 mN/m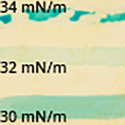 |
| 40 s |
Total: 54.1 mN/m Polar: 6.4 mN/m Disperse: 47.7 mN/m |
Total: 34 mN/m |
Total: 34 mN/m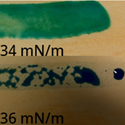 |
| 60 s |
Total: 61.7 mN/m Polar: 14.25 mN/m Disperse: 47.44 mN/m |
Total: 36 mN/m |
Total: 38 mN/m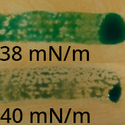 |
| c) PET | |||
| Duration | SFE by OWRK from contact angles |
Test ink A | Test ink B |
| 0 s |
Total: 47.2 mN/m Polar: 1.6 mN/m Disperse: 45.6 mN/m |
Total: 34 mN/m |
Total: 34 mN/m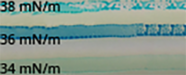 |
| 40 s |
Total: 70.2 mN/m Polar: 26.1 mN/m Disperse: 44.1 mN/m |
Total: 54 mN/m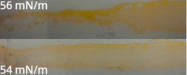 |
Total: 54 mN/m |
Tab. 3 a-c: Results of comparative measurements between contact angles and ink tests for three untreated and plasma-treated plastics
With methods such as plasma or corona treatment, polar groups are introduced into the surface structure due to oxidation. The change in SFE is therefore based substantially on the increase in the polar fraction. This effect of treatment is shown throughout in the evaluations of contact angle according to OWRK. The very significant increase in SFE due to plasma treatment comes about almost entirely as a result of the increase in polar fraction.
The test inks do not reflect the increase in SFE for PDMS and PVC. With these two plastics, the test inks are to a certain extent blind to the effect of treatment.
In the case of PET, the effect of pretreatment is visible to a greater extent in the ink test, but here too the values lead to an under-estimation of the effect of plasma treatment.
Advantages of contact angle measurement in practice
As well as the reliable measurement of SFE in the overall polarity spectrum of solid materials, there is also a series of other advantages compared with the test ink method. For example, additional information can be gained from the contact angle measurement if the wetting liquid is also characterized. Calculating the work of adhesion (see Fig. 5) and the IFT provides insight into the quality of an interfacial contact which cannot be obtained from the ink test. The work of adhesion describes the force with which the two phases bond to one another. The IFT refers to the inherent tension of an adhesive bond or coating. When the IFT is high, unwanted detachment of the phases from one another occurs more easily, for example due to the penetration of moisture.
Some test inks, in particular the range mixed in accordance with ISO 8296, contain the toxic liquids formamide and EGMM. As a result, the health of test personnel can be endangered during routine quality assurance. Contact angle measurements can be carried out with harmless liquids or with liquids which are less hazardous to health. In addition, significantly smaller amounts of the substance are required for the measurement than with the ink test.
Test inks on an ethanol basis, such as test ink A in our study, are also available as less harmful substitutes. In this case, however, the volatile alcohol content can partially evaporate, so that the composition of the ink changes if bottles are left open or are opened frequently. For the same reason, the wetting behavior can change when the ink is applied. This disadvantage is more serious at higher temperatures.
A further advantage of the contact angle method is that the test media do not come into direct contact with the sample. As a result, the test liquids cannot be contaminated by the sample. In the case of a test ink, the pen is brushed over the sample and, after the test, can contaminate the whole ink supply in the bottle.
Many samples only offer a small area for carrying out a wetting test. However, test inks require a relatively large amount of space for applying several lines which must not run into one another. On the other hand, the SFE can be measured on a few square centimeters by means of contact angles.
Until the development of fast and manageable contact angle measuring instruments, test inks offered advantages for testing surfaces directly on site. With our Mobile Surface Analyzer - MSA, the measurement of SFE is just as portable and even faster than an ink test.
In addition, with the ink test different interpretation of the wetting behavior is possible so that the results depend on the person carrying out the test. With the MSA, the result is independent from subjective assessment due to computerized automation of the measurement and evaluation.
Summary
A comparative study of contact angle measurements and ink tests on 13 materials identified major differences in the SFE values in many cases. A good correspondence was only obtained for two low-energy, non-polar plastics.
We were able to explain the differences with reference to the OWRK wetting model. For good wetting, this requires a compatibility of the phases with regard to the polar and disperse infractions. This is not a prerequisite of the ink test. It is highly probable that an ink, whose total SFT is equal in value to the SFE of the solid, has a different polarity and does not completely wet the sample.
In comparative measurements on three plasma-treated plastics, the effect of treatment on two of the materials could only be detected by means of the contact angle and not by means of the ink tests. In the case of the third plastic, the results of the contact angle evaluation were significantly higher than those of the ink tests.
As well as the systematic advantages of contact angle measurement based on sophisticated theory, we have also highlighted some benefits of the measuring method in practice. These include the reduced health hazard due to harmless substances and smaller quantities compared with the ink test.
The non-contact process compared with the ink test avoids possible contamination of the liquids. The small test area required for contact angle measurement and the possibility of carrying out measurements at higher temperatures are also beneficial. Former advantages of the ink test, such as mobility and speed, cease to exist thanks to the use of new, handy instruments such as the Mobile Surface Analyzer – MSA. A further advantage of the MSA lies in the completely automated measurement which is independent from an assessment by the user.
Bibliography
- D. H. Kaelble, Dispersion-Polar Surface Tension Properties of Organic Solids. In: J. Adhesion 2 (1970), P. 66-81.
- D. Owens; R. Wendt, Estimation of the Surface Free Energy of Polymers. In: J. Appl. Polym. Sci 13 (1969), P. 1741-1747.
- W. Rabel, Einige Aspekte der Benetzungstheorie und ihre Anwendung auf die Untersuchung und Veränderung der Oberflächeneigenschaften von Polymeren. In: Farbe und Lack 77, 10 (1971), P. 997-1005.


