
Wetting and roughness – What to do if Wenzel does not work?
How contact angle measurements and confocal microscopy can provide an empirical solution
The fact that the roughness of a surface can influence its wetting behavior is well known and described by Wenzel in his theory with a simple equation. But how well can this theory be transferred to industrial practice? We did the test and microstructured silicon wafers very precisely by reactive ion etching, but without changing the chemical structure of the surface and thus its surface free energy.
The microstructure of the surfaces was measured by confocal microscopy to determine the parameters relevant to Wenzel's theory. Contact angle measurements on the differently structured samples surprisingly showed a correlation contrary to Wenzel's prediction. This example shows that a correction of contact angle data, which uses Wenzel's assumptions as sole basis, is not recommended. However, by measuring both roughness and contact angle, an empirical solution can often be found in practice to separately investigate and ultimately predict the effects of roughness and surface free energy on wetting behavior.
Background
Wetting of structured surfaces – Cassie-Baxter and Wenzel states
In addition to its chemical composition, the topography also has an influence on the wetting behavior of a surface. A distinction is made between two cases: If the liquid of an applied drop penetrates into the (micro) structures and displaces the air in them, this is called a Wenzel state (Fig. 1, left). If air inclusions remain in the structures, this is referred to as the Cassie-Baxter state (Fig. 1, right). [2]

Which state is present depends on the size and shape of the structures, the surface free energy of the base material, and the surface tension of the liquid.
According to Wenzel, the following relationship applies between Young's contact angle θ on an unstructured surface and the contact angle θ* on a structured surface of the same material: [1]

where the roughness factor r describes the surface roughness and corresponds to the ratio between the geometric and projected surface of the microstructures:

Since the projected surface cannot be larger than the geometric one, r is always ≥ 1. It follows that according to the Wenzel equation the contact angle becomes smaller below 90° and larger above 90° due to the structuring. 90° is at the same time the limiting angle of wettability, so that hygrophilic materials become even more hygrophilous and hygrophobic materials even more hygrophobic.
Considering these equations, it is apparently easy to predict the wetting behavior of structured surfaces if θ and r are known. Conversely, it would be possible to determine the proportionate effect of technical processes such as sandblasting or plasma activation on surface roughness (r) and surface chemistry in the form of the contact angle on an ideally smooth surface (θ). Whether the Wenzel equation allows such a direct correction in practice was investigated by us in the context of this report.
Experimental part
Sample preparation
As solid samples, the 5microns GmbH company (Ilmenau, Germany) sawed differently structured chips from a silicon wafer. The structures were realized anisotropically by reactive ion etching. A schematic representation of the structured silicon chips is shown in Fig. 2. The structures are open, which in contrast to inversely structured, closed structures allow air to escape when wetted by liquid. The trench width A was varied between 5 and 50 µm, the structure size B between 10 and 50 µm. Target depths of the structures were 5 µm each. Regardless of the target structure, all samples had the same, uniform chemical structure of the surface (silicon dioxide).

The roughness factor r for the structures used is calculated according to:

Analysis of the surface structure
The surface structure of the silicon chips was measured with a Twip Consigno confocal microscope. With this instrument, the use of a microlens technique allows high light yields, which means that very dark or even transparent samples can be measured with high axial resolution. Other common methods, such as triangulation/stripe light projection, are limited in their application, e.g. by reducing the height measurement range while maintaining low resolution, by problems with differently reflecting samples, and by "shadowing" effects, by which structures can be hidden and thus overlooked. The measurements were performed with an objective with 100× magnification. The scanned area was 0.19 × 0.15 mm² each with a height range of 15 µm. For the measurements the software "itom" was used. For the determination of r, a 0.8 µm roughness cutoff filter was applied to the acquired images.
Contact angle measurements
Contact angle measurements were carried out with a KRÜSS Drop Shape Analyzer – DSA100, using the ADVANCE software. For this purpose, five drops of double distilled water were placed on each chip with the aid of a software-controlled needle dosing system and their equilibrium contact angle (CA) was determined. The drop volume was 2 µL, all measurements were performed at 23 ± 0.5 °C. The result is the mean value with standard deviation for all hydrocarbon values per sample.
Results
Calculated and measured roughness factors r
Figure 3 shows the surface topography of an exemplary microstructured sample. The dimensions of the structures correspond well with the dimensions specified by the manufacturer 5microns GmbH.

Based on the measured topographic dimensions of the samples, the software determines the r factor used in the Wenzel equation. Figure 4 shows the experimentally determined r factors and those calculated according to the target geometry of the structures for all investigated samples. Measured and theoretical values agree well, the largest deviation is below 5% (sample 5-10).

Contact angle
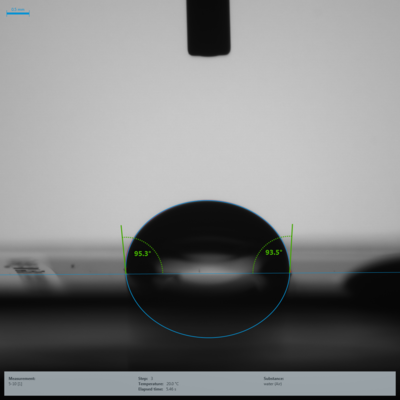
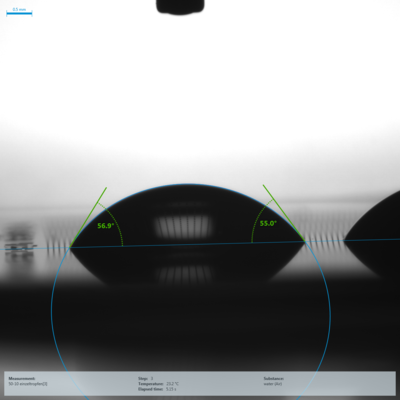
To investigate whether the wetting behavior of the structured samples follows the prediction of Wenzel, contact angle measurements were performed with water as test liquid (Fig. 5). For structures with low r values, the microstructure is partially visible in the drop images (see Fig. 5, bottom).
|
|
||
|
Fig. 5: Exemplary drop images on the two structured samples with the highest (A = 5 µm, B = 10 µm, r = 1.889, top) and lowest (A = 50 µm, B = 10 µm, r = 1.059, bottom) r value |
Deviation from the postulated course according to Wenzel
The results of the contact angle measurements are compared to the corresponding r values of the samples in Figure 6. In addition, the expected course based on the Wenzel equation is shown there, using on a contact angle of θ = 35.18°, which was measured on the unstructured silicon chip. It can be clearly seen that compared to the trend predicted on the basis of Wenzel's theory, an opposite trend of the resulting contact angles as a function of r is observed. A hydrophilic surface becomes more hydrophobic and not more hydrophilic by surface structuring.

This discrepancy between prediction and measurement values can have many causes, which would go beyond the scope of this report if discussed in detail. In the scientific literature there is a large number of publications that deal comprehensively with the conditions for Wenzel and Cassie-Baxter states and their transitions into each other. If you are interested, please refer to the work of Park et al. [3] The clear result of our investigations is that even with very well-defined surface structures and water as the most common test liquid, a simple prediction of the wetting behavior using the Wenzel equation is not easily possible. It is true that there are examples where the Wenzel relation allows a prediction. In practice, however, there is no way around contact angle measurements and measurements of the surface structure using a suitable method such as confocal microscopy if reliable results are required.
Development of an empirical model as a viable alternative
Practically relevant, however, is the possibility to determine an own empirical relationship between r-parameter and contact angle based on the measurement results shown here. This can be used in our example to predict the influence of different surface structures on the wetting behavior or to extrapolate the contact angle on a completely unstructured surface (r = 1) (see Fig. 6, light blue linear fit). This in turn shows the influence of a pretreatment only on the surface chemistry independent of roughness effects.

Summary
Wenzel describes in a simple equation how the surface roughness r influences the wetting of a surface in terms of the contact angle. Here, this equation was subjected to a practical test by measuring water contact angles on well-defined surfaces of the same chemical composition but different surface roughness between r = 1 and r = 1.89. It was shown that the surface topography of microstructured samples can be determined very precisely using a confocal microscope.
Contrary to the prediction of the Wenzel equation, an inverse trend for the contact angle with increasing roughness was observed experimentally. Wetting is determined by both the material of the surface and its topography. If the contact angle on a structured surface is known, one should not blindly rely on being able to predict the Young contact angle on a smooth surface of the same material using the Wenzel equation. On the basis of the measurements described, the validity of the Wenzel equation can be checked in practice and, if necessary, replaced by a simple empirical relationship (Fig. 7). This in turn allows an extrapolation of the wetting behavior for unstructured surfaces and an estimation of the extent to which surface chemistry and surface roughness influence the wetting behavior.
Bibliography
- [1] R. N. Wenzel, “Resistance of Solid Surfaces to Wetting by Water”, Ind. Eng. Chem. 28, Nr. 8, S. 988–994, (1936).
- [2] A. B. D. Cassie, S. Baxter, “Wettability of Porous Surfaces”, Trans. Faraday Soc. 40, S. 546–551, (1944).
- [3] C. I. Park, H. E. Jeong, S. H. Lee, H. S. Cho, K. Y. Suh, “Wetting transition and optimal design for microstructured surfaces with hydrophobic and hydrophilic materials”, J Colloid Interf Sc 336, S. 298–303, (2009).


